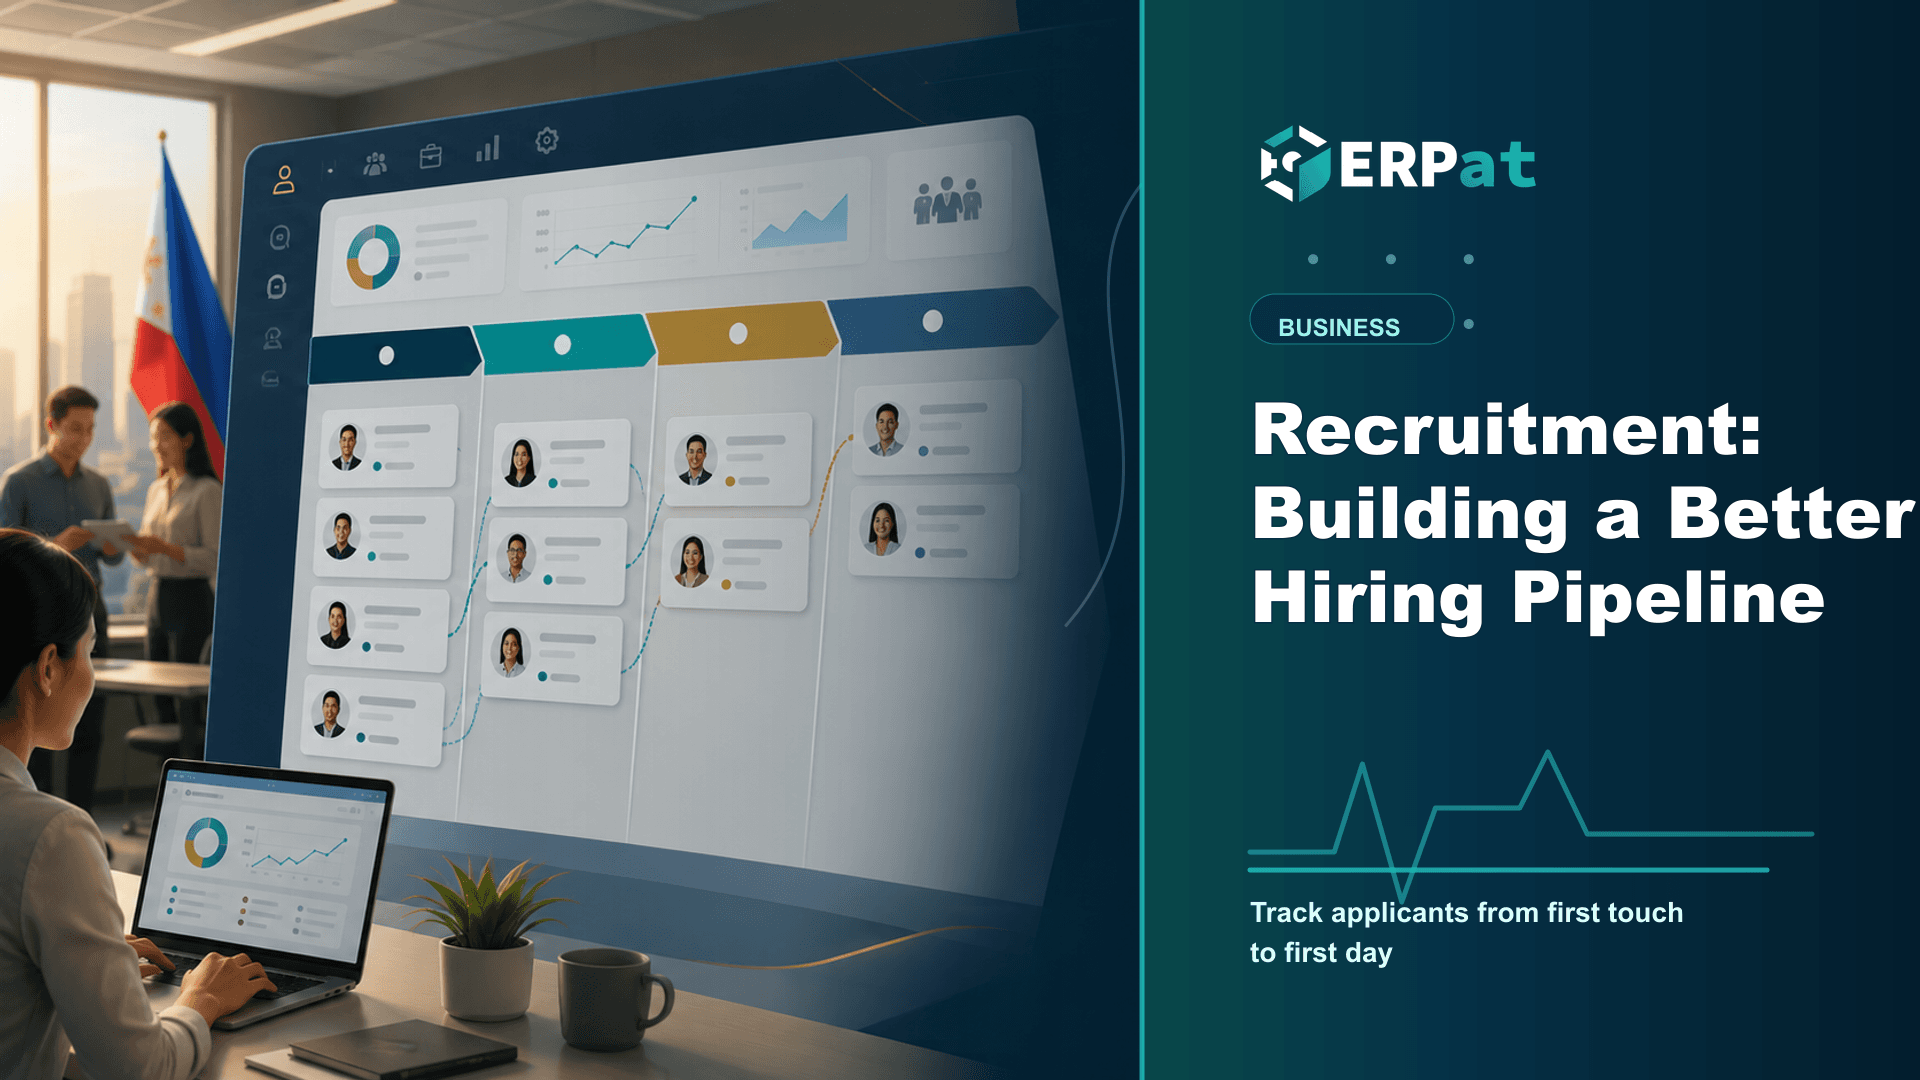

Recruitment Analytics: Measuring Your Hiring Funnel
Most hiring problems are stage problems, not volume problems. This guide shows how to measure time-to-fill honestly, find the stage where candidates drop off, and judge sources by hires rather than applicant counts.
In this guide
What to watch for
Use the article to identify repeat work, handoff gaps and places where one source of truth would help.

In this article
Every HR team has a rough sense of how hiring is going. The requisition has been open a while, the shortlist is thin, and someone near the top of the pipeline went quiet last week. What most teams do not have is a way to turn that impression into numbers they can compare across roles, months and hiring managers. That gap is the difference between suspecting that recruitment is slow and knowing exactly which stage is slowing it down.
Your funnel is already producing data
Recruitment analytics sounds like a separate project. In practice it is mostly a matter of reading records you are already creating. Running job postings, applicant pipelines and interview stages through to offer and onboarding in the Recruitment module means every candidate carries a trail: when they applied, which posting they came from, which stage they sat in, and when they moved or stopped moving.
That trail is the raw material. A funnel report is simply the same information counted sideways — instead of asking "where is Maria in the process," you ask "how many people were at screening this month, and how many of them reached an interview." Nothing new has to be captured, which is exactly why this is worth doing: the measurement costs you almost nothing beyond the discipline of keeping stages current.
The value is in comparison. One requisition tells you very little. Twenty requisitions across two quarters, grouped by department and role level, start to show patterns that no single hiring manager would ever notice from inside their own search.
Time-to-fill is two questions, not one
Teams usually quote a single number for how long hiring takes, and that single number hides the most useful distinction in the whole funnel. Time-to-fill runs from the moment a requisition is approved to the moment an offer is accepted. Time-to-hire runs from the moment a specific candidate enters your pipeline to the moment that same candidate accepts. They answer different questions.
A long time-to-fill with a short time-to-hire means your process is fine but your pipeline is starving — you convert people quickly once you find them, and the delay sits in sourcing or in the approval that precedes it. The reverse pattern means candidates are plentiful and the bottleneck is internal: scheduling, feedback, sign-off. The remedy for each is completely different, which is why collapsing them into one figure so often produces the wrong fix.
Two habits make the numbers more honest. Use the median rather than the average, because one long-running hard-to-fill role will drag a mean badly out of shape. And segment by role type before you compare anything — a warehouse hire and a senior accountant do not belong in the same statistic.
Read the funnel stage by stage
The most actionable view is conversion between adjacent stages: applied to screened, screened to interview, interview to offer, offer to accepted. Each ratio points at a different owner and a different cause, and the shape of the drop-off usually identifies the problem before you have finished reading the column.
Heavy loss between application and screening generally means the posting is attracting the wrong people — the job description, the channels, or the stated requirements are pulling in volume rather than fit. Loss between interview and offer points inward, at calibration: interviewers and hiring managers are working from different pictures of the role. Loss at the offer stage is the most expensive of all, because you have already spent the effort, and it usually traces to compensation expectations that were never surfaced early or to a process that simply took too long.
Look at the absolute counts alongside the ratios. A stage that converts poorly but only ever sees a handful of candidates is a smaller problem than a stage with a respectable ratio and a queue sitting in it for weeks.
Not all applicants are worth the same
Source reporting is where recruitment analytics most often goes wrong, because the easiest thing to count is applications and the least useful thing to know is which channel produced the most of them. A source that floods you with unqualified applicants creates screening work, not hiring capacity.
Rank sources by what survives instead. For each channel — referrals, job boards, social posts, walk-ins, your own careers page — count how many candidates reached the final interview stage and how many were eventually hired. Set that against the effort and cost the channel required. Channels that produce fewer applicants but a much higher share of finalists are usually your best investment, and referrals frequently look strongest under this lens once you stop judging by volume.
This only works if the source is recorded at intake, consistently and with a fixed list of options. Free-text entry turns into a dozen spellings of the same job board and quietly destroys the report six months before anyone tries to run it.
Close the loop with what happens after onboarding
Funnel metrics end at acceptance, but the real question is whether the people you hired turned out well. That answer lives on the other side of onboarding, in performance data. The KPI Matrix module holds performance scorecards that weight metrics by role and roll them into a team matrix, so once a cohort of new hires has been through a scoring cycle or two, you have a defensible read on how they are actually performing.
Joining the two views is what turns recruitment reporting into recruitment strategy. Group your scored employees by the source that brought them in, by the hiring manager who ran the loop, or by how long their process took, and you start to see which parts of your funnel produce people who stay and perform. It is a slower loop than time-to-fill — you need at least a couple of review cycles before the comparison means anything — but it is the only metric that measures hiring quality rather than hiring speed.
Stage dates are only accurate if recruiters move candidates when it happens, not in a bulk cleanup before a meeting. Rejections that are never recorded make every conversion rate look better than it is.
Start small and let the baseline build
You do not need a year of clean history to begin. Pick one role you hire repeatedly, agree on what each stage means, and record every applicant against those stages for a single quarter. That first baseline will be imperfect, and it will still tell you more than the impressions you are working from now. Add roles once the habit holds, and let the comparisons accumulate — recruitment analytics rewards consistency far more than it rewards sophistication.
Technology decision context
Use "Recruitment Analytics: Measuring Your Hiring Funnel" to make a better systems decision
Technology articles are most useful when they help the team decide what to change next. Focus on the process problem first, then choose the tool or integration that removes the most repeated work.
Part 1Start from the workflow, not the tool
A system change should solve a visible operational problem. Map who creates data, who reviews it and who depends on the result.
- Identify repeated encoding, manual exports and duplicate records
- Find handoffs that rely on reminders instead of system status
- Separate must-have controls from nice-to-have interface features
Part 2Integration details to check
A useful system should reduce context switching and make data easier to trust across teams.
- Which records need one source of truth?
- Which reports depend on data from more than one department?
- What permissions, audit logs and backups are required?
Part 3How to judge success
A better technology setup should improve speed, reliability and confidence in decisions.
- Fewer manual workarounds after rollout
- Shorter time from request to approval or report
- Clear ownership when something is missing or incorrect
Jerome Evangelista
Content & Solutions Writer
Writes about payroll automation, HRIS, and how Philippine businesses run leaner with ERPat.