Overview #
The Gantt Charts Module is used to visualize project timelines, tasks, and milestones in a structured time-based layout. It enables teams to monitor project schedules, track task progress, and understand dependencies between activities. This module supports planning and execution by providing a clear graphical representation of project workflows across specific dates. Each timeline displayed reflects data sourced from the Projects and Tasks modules.
Key Features #
- Visual timeline of project activities
- Milestone-based grouping
- Read-only task scheduling view
- Project progress monitoring
- Dependency visualization
- Project-based filtering
- Status-based filtering
- Timeline day view
- Integration with Projects and Tasks modules
Accessing the Gantt Charts Module #
- Log in to the ERPat System.
- Navigate to Planning from the main sidebar.
- Select View Gantts.
You will be directed to the Gantt Chart page, displaying project timelines and task schedules.
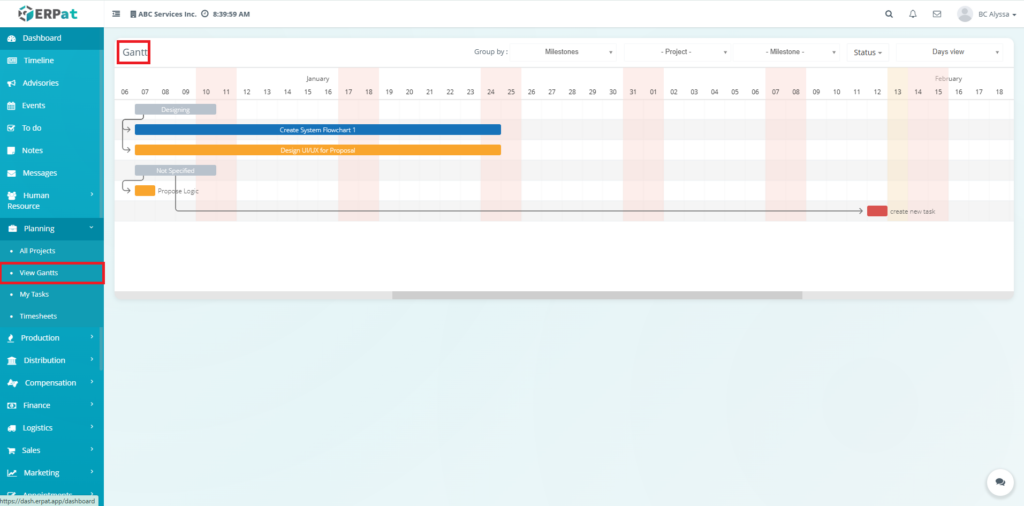
Gantt Charts Page #
The page provides a timeline overview of project activities with the following elements:
- Timeline Header – Displays calendar dates across months
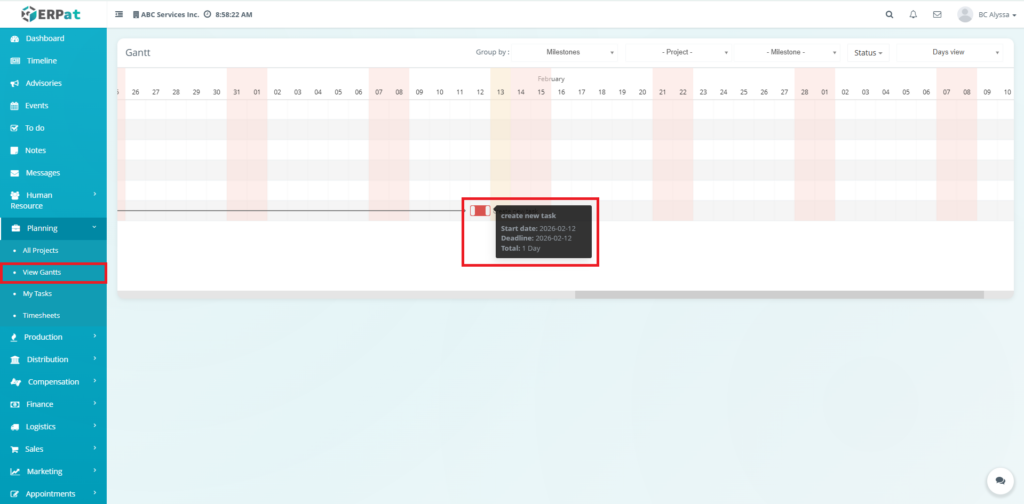
- Task Bars – Visual representation of task duration
- Milestones – Key checkpoints within the project
- Dependencies – Task relationships and sequence flow
- Project Tasks – Activities linked to specific projects
- Status Indicators – Progress and scheduling alignment
Data Source #
Tasks and timelines displayed in the Gantt Chart are automatically generated from:
- All Projects
- My Tasks
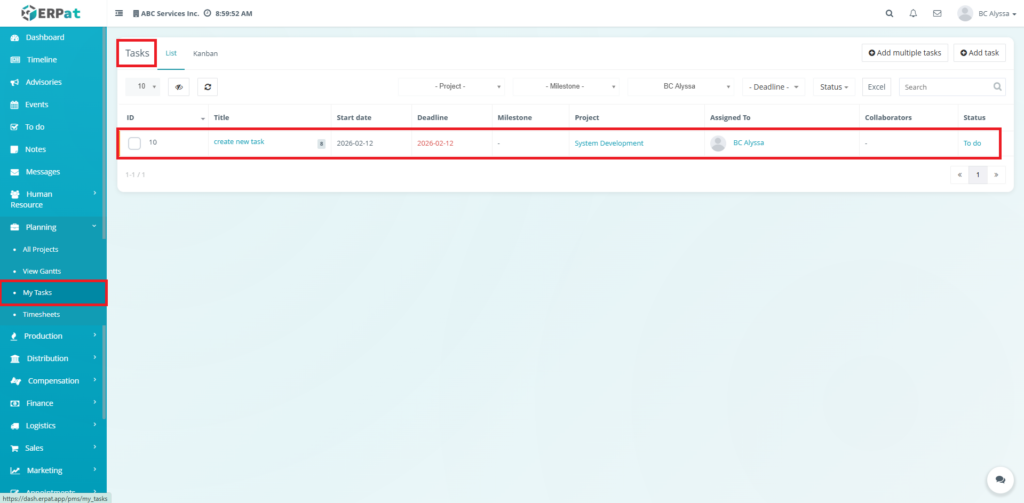
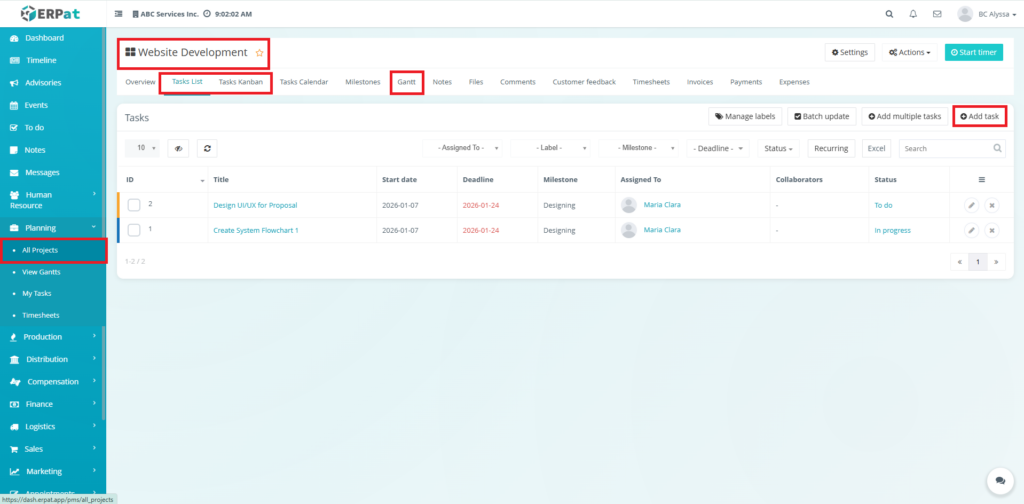
Important:
The Gantt Chart is a read-only reporting view.
Users cannot create, edit, or delete tasks directly from this module
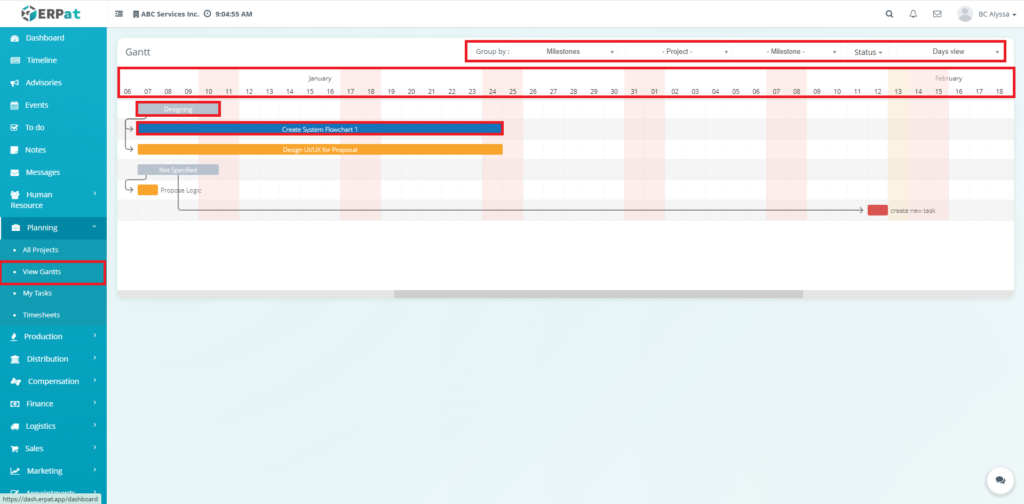
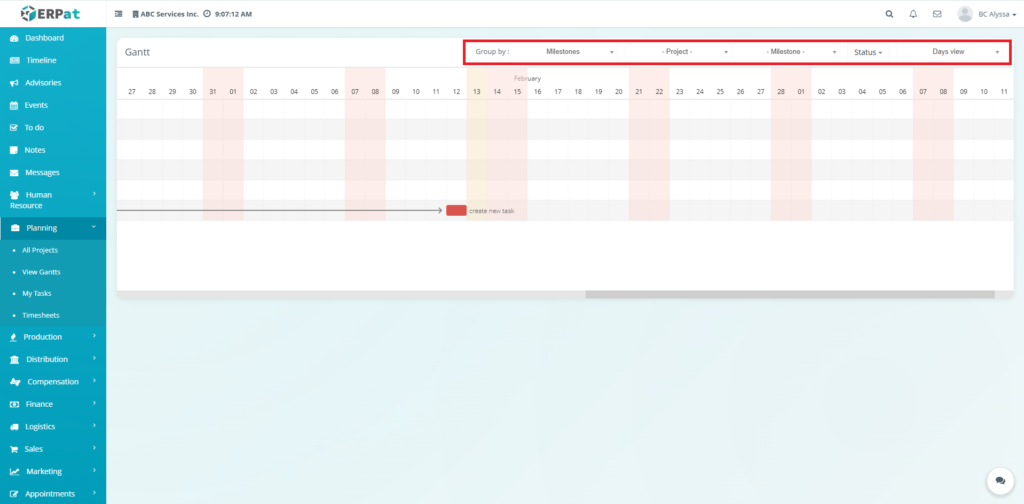
Filters and Viewing Options #
Users may customize the timeline view using:
- Group By – Organize tasks by Milestones
- Project Filter – Display selected project timelines
- Milestone Filter – Focus on specific phases
- Status Filter – View tasks by progress state
- Days View – Adjust timeline granularity
These controls help refine reporting visibility.
Milestones #
Milestones represent major project phases.
They:
- Segment project timelines
- Provide progress checkpoints
- Help organize task groupings
Dependencies #
Dependencies show the sequence between tasks.
They help users:
- Understand workflow order
- Identify bottlenecks
- Monitor scheduling impact
Permissions and Access Control #
- Accessible to authorized Planning users
- View-only for most operational roles
- Editing permissions are managed in the Projects / Tasks modules
Best Practices #
- Maintain accurate task schedules in the Projects or Tasks modules
- Use milestones for better timeline segmentation
- Regularly review the Gantt Chart for deadline tracking
- Avoid relying on the Gantt for task updates — it is for monitoring only
Audit & Logs #
Since the Gantt Chart is a reporting module, no direct actions are logged here. However, all timeline changes originating from Projects or Tasks are recorded in their respective audit logs.
Last Updated: [February 13, 2026] Module Owner: Planning IS – ERPat System


