Overview #
The Financial Analysis module within the Reports section of ERPat provides a comprehensive suite of tools for monitoring the organization’s fiscal health. It consolidates real-time data from various financial transactions into high-level summaries and detailed accounting statements. This module is essential for stakeholders to track profitability, manage cash flows, and ensure the balance between assets, liabilities, and equity.
Key Features #
- Multi-Dimensional Financial Tabs: The module is organized into four distinct analytical views:
- Summary: Features a visual Comparison Graph that tracks monthly Income vs. Expenses.
- Cash Flows: Tracking the movement of liquid capital.
- Income Statements: Provides a monthly tabular breakdown of Income, Expenses, and resulting Profit (Loss), alongside Receivables and Payables.
- Balance Sheet: A detailed ledger showing the Debit, Credit, and Balance for specific account names and numbers.
- Visual Trend Analytics: The Summary tab includes a dynamic area chart that helps identify seasonal financial trends and budget variances at a glance.
- Dynamic Filtering & Search: Users can filter data by specific Projects or Fiscal Years to generate targeted financial insights.
- Export Capabilities: Features an Excel export button to download financial statements for external audits or offline reporting.
- Account-Level Granularity: The Balance Sheet provides specific tracking for account numbers and names, ensuring full transparency in the general ledger.
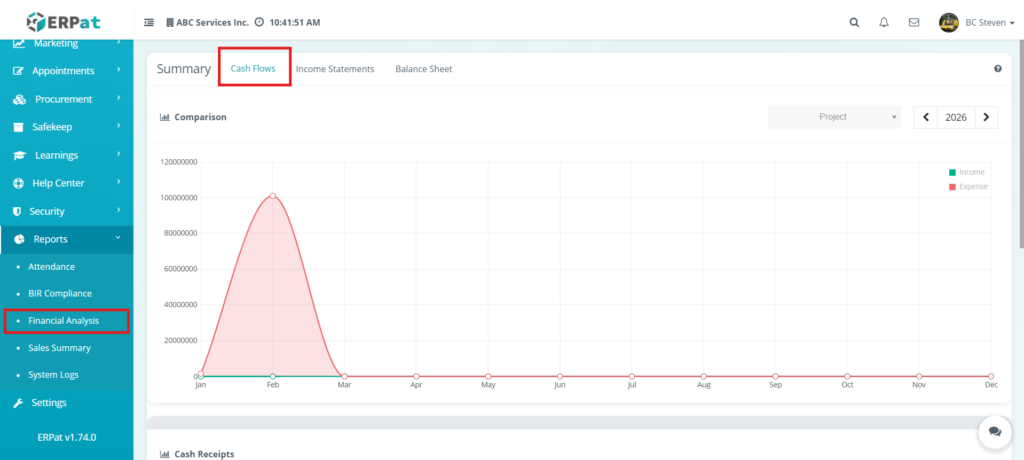
Accessing the Financial Analysis Reports #
To access the financial reporting suite and audit your organization’s fiscal status, follow these steps:
- Log in to the ERPat System.
- On the left-hand Sidebar Menu, navigate to the Reports section.
- Click the Reports dropdown to expand it and select Financial Analysis.
- By default, the module opens on the Summary tab. You can switch between Cash Flows, Income Statements, and Balance Sheet using the top navigation bar.
- Use the Year Picker and Project Filter at the top-right to adjust the scope of the data.
- Click the Refresh or Search icons to update the views based on your selected criteria.
Financial Analysis: Summary Dashboard #
1. Global Filters & Navigation #
Located at the top-right of the dashboard, these controls allow you to define the data scope:
- Project Filter: Narrows the financial data to a specific project or business unit.
- Year Selector: Allows users to toggle between different fiscal years to perform year-over-year comparisons.
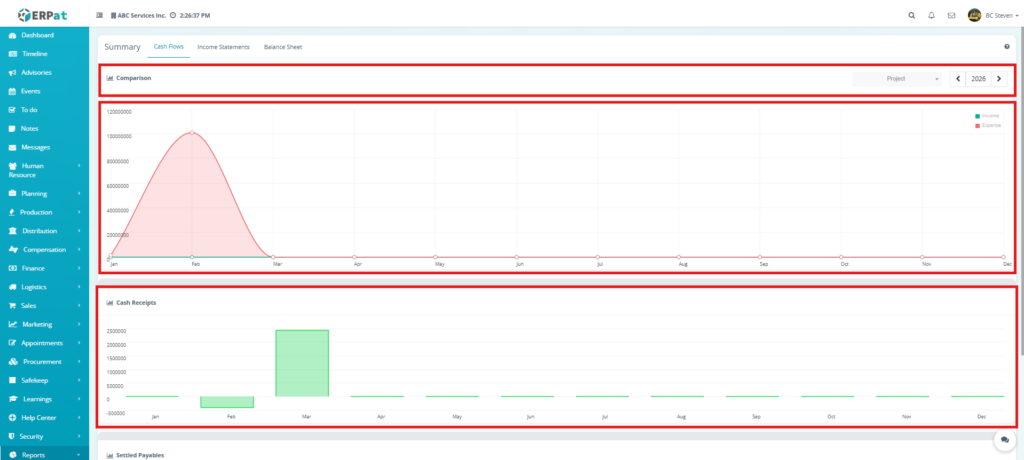
2. Comparison Graph (Income vs. Expense) #
This primary area chart provides a month-by-month visual of the company’s financial health:
- Income (Green Line): Tracks total revenue generated.
- Expense (Red Area): Highlights total spending.
- Trend Identification: The chart clearly visualizes anomalies, such as the significant expense peak shown in February, which helps management investigate large-scale disbursements at a glance.
3. Cash Receipts #
A bar chart that tracks the actual inflow of liquid capital:
- Inflow Mapping: Displays positive and negative cash movements per month.
- Performance Benchmarking: For example, the chart shows a substantial positive spike in March, indicating high collection or capital injection during that period.
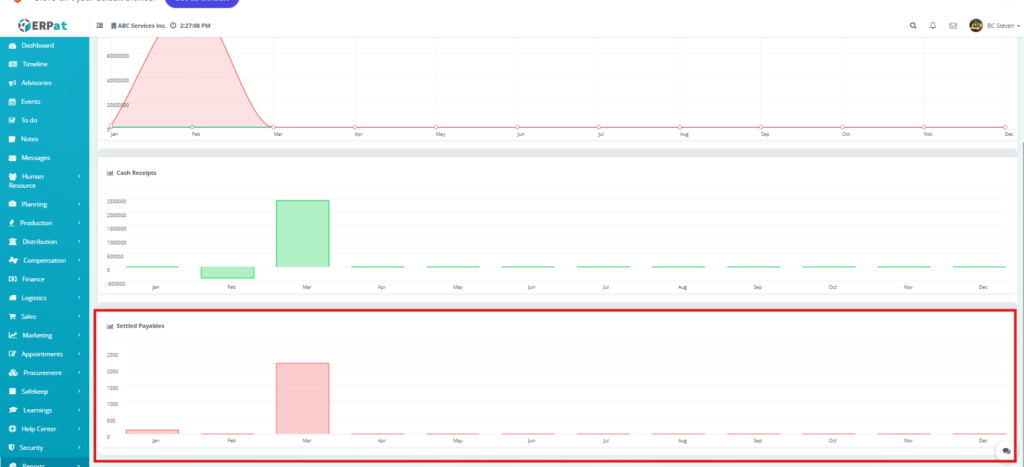
4. Settled Payables #
This chart tracks the organization’s outgoing payments to creditors and suppliers:
- Debt Resolution: Measures how much of the company’s liabilities are being actively settled.
- Liquidity Tracking: Visualizes payment patterns, such as the increased settlement activity in March, helping to assess the company’s cash outflow requirements.
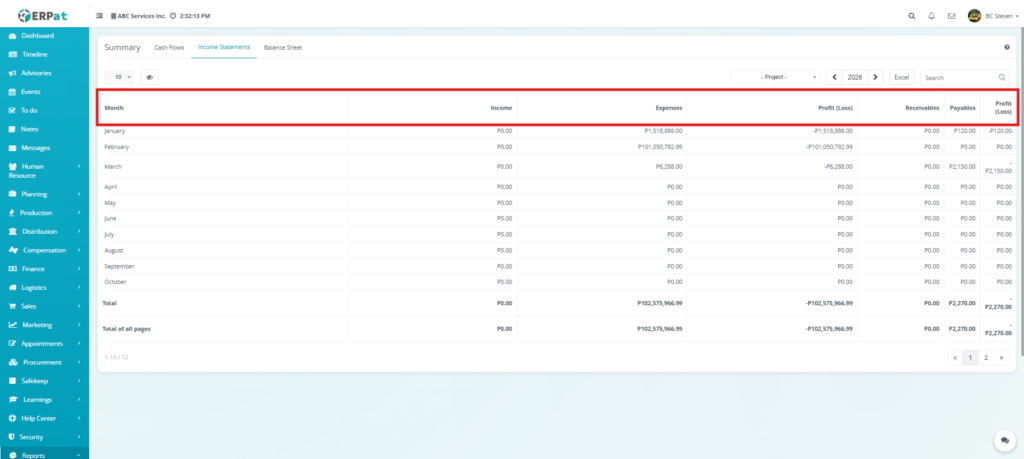
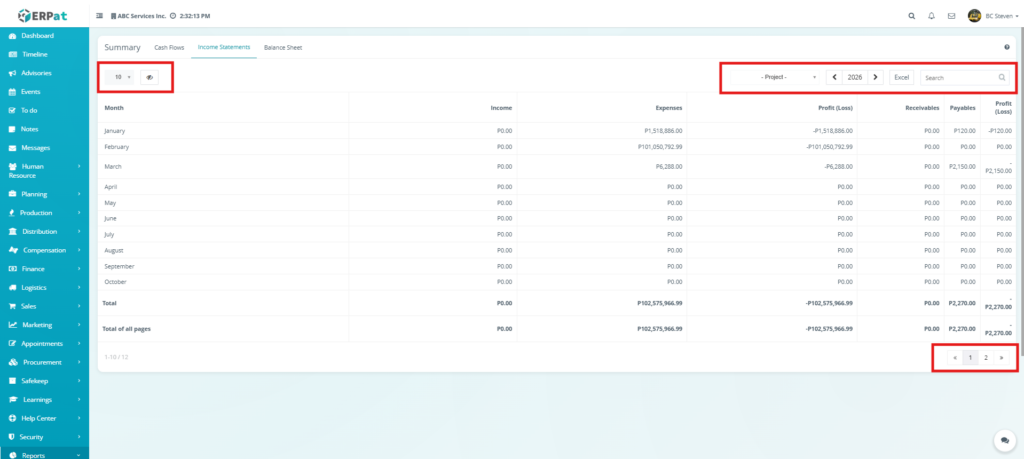
Financial Analysis: Income Statements Tab #
Column Definitions #
- Month: Lists the specific month for the recorded financial activity .
- Income: Displays the total gross revenue generated from all sources within that month.
- Expenses: Tracks all outgoing costs, including operational expenses, payroll, and overhead.
- Profit (Loss): Calculated as Income – Expenses. A negative value indicates a loss, showing that expenses exceeded revenue.
- Receivables: Tracks money owed to the company by clients or customers that has not yet been collected.
- Payables: Lists the company’s outstanding debts or obligations to suppliers and creditors.
- Profit (Loss) [Final Column]: A secondary calculation field typically used to show the net result after adjusting for other financial variables.
Additional Management Controls & Filtering #
- Data Scope & Navigation:
- Project Filter: A dropdown menu that allows users to isolate financial statements for a specific business unit or client project.
- Fiscal Year Navigator (2026): Features a year display with directional arrows to move between previous and current fiscal periods.
- Excel Export: A high-priority button to instantly generate and download the tabular data into an Excel spreadsheet for external reporting or tax preparation.
- Global Search Bar: A real-time lookup tool on the far right used to search for specific financial figures, months, or entries within the statement.
- Pagination for Large Datasets:
- Page Numbers & Arrows: Since financial records can span multiple years or projects, these controls allow users to navigate through all pages of the statement (e.g., moving between Page 1 and Page 2 without overwhelming the interface.
- Refresh and Visibility Controls:
- Row Display: Sets the number of monthly records visible on a single screen.
- Column Visibility: Enables the user to hide or show specific financial metrics to create a more focused view of core Income and Expenses.
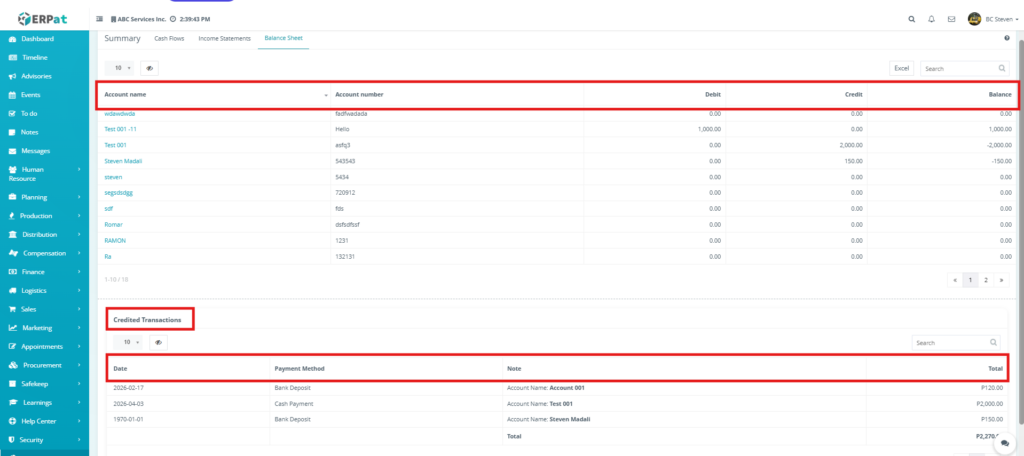
Financial Analysis: Balance Sheet Tab #
1. Account Balances Table #
The primary table displays the cumulative status of individual financial accounts. The red highlighted header row defines these tracking metrics:
- Account name: The descriptive title of the ledger account.
- Account number: The unique alphanumeric identifier for the account within the Chart of Accounts.
- Debit: Increases in assets or expenses.
- Credit: Increases in liabilities, equity, or revenue.
- Balance: The net total of the account. A negative balance indicates a credit-heavy account.
2. Credited Transactions Table #
This supplementary ledger provides a detailed history of specific credit entries that impact the balance sheet totals.
- Date: The exact timestamp when the transaction was recorded.
- Payment Method: The medium used for the transaction, such as Bank Deposit or Cash Payment.
- Note: Contextual details regarding the entry, typically identifying the target account.
- Total: The specific monetary value of the credited transaction.
Additional Management Controls & Filtering #
- Export & Global Search
- Excel Export: A primary button to download the entire Balance Sheet dataset. This is essential for external auditing and historical data archiving.
- Search Bar for Quick Lookup: A real-time filter for the Account Balances table. Users can search by Account Name or Account Number to instantly view specific ledger statuses.
- Table-Specific Search:
- Transaction Search: A dedicated search bar for the Credited Transactions table. This allows users to find specific entries by searching for a Payment Method or a specific Note.
- Pagination for Large Datasets:
- Multi-Page Navigation: Both the upper and lower tables feature individual pagination controls. This ensures high performance when viewing hundreds of different accounts or a long history of credits.
- Refresh and Visibility Controls:
- Row Display: Allows users to set the number of records visible per page for both the main ledger and the transaction history.
- Column Visibility: A toggle tool to hide or show specific data columns, such as Debit or Credit, to focus purely on the net Balance.
Permissions and Access Control #
- Authorized Roles: Access to the Balance Sheet is restricted to Chief Financial Officers (CFO), Senior Accountants, and Authorized Auditors.
- View-Only Access: Internal auditors or high-level stakeholders may be granted read-only access to verify account balances without the ability to trigger exports or modify underlying data.
Best Practices #
- Verify Balanced Entries: Always ensure that the Debit and Credit columns across all accounts are reconciled before finalizing monthly reports.
- Detailed Transaction Notes: When recording payments, ensure the Note field is descriptive. This makes the Search Bar in the Credited Transactions table much more effective for quick lookup.
- Regular Excel Backups: Use the Excel Export feature at the end of every fiscal month to maintain an offline “snapshot” of the company’s financial position.
Audit & Logs #
- Financial Traceability: Every search, filter, and export action performed on the Balance Sheet is tracked within the ERPat System.
- Integrity Assurance: All data feeding into the Balance Sheet is logged with the User ID of the person who encoded the transaction and a precise Timestamp, ensuring full accountability for every peso recorded.
Last Updated: [March 24, 2026]
Module Owner: Reports IS – ERPat System


